Supply and Demand Research Report
Promoted by Propertyology.
Practically everything on earth which has a dollar value is determined by the relationship between supply and demand. The price of products such as fruits and vegetables, coal and oil, may largely be determined by the linear equation between “how much is available” (supply) and “how much is required” (demand).

The price of property is a much more complexed equation. While the forces of ‘supply’ and ‘demand’ are still at play,the factors which influence supply and demand are numerous.
At a macro (national) level, Australia has experienced two periods of pronounced price growth during the last 20 years. The first era was 2001 through to 2007 and the entire country benefitted from it. Capital cities such as Perth, Brisbane and Hobart saw prices more than double in only five years, various regional locations did even better, while Sydney was the worst-performed capital city.
The second boom was 2013 to 2017, although it was largely contained to Sydney, Melbourne and Hobart. Outside of these locations, property markets have been largely underwhelming post-GFC.
That said, very prudent lending practices and sensible monetary policy are pillars for Australia’s resilient property markets.
Historically low interest rates ~ the RBA Cash Rate hasn’t changed since August 2016 ~ is a reflection of a stable economy that has failed to grow at any great rate, thereby meaning limited wage growth. The 2017 calendar year was an Australian record for job growth. The medium and long-term outlook for Australia’s economy is buoyed by improving world economies and a plethora of opportunities that will continue to unfold throughout the Asian Century.

Australia’s population increased by an average of 375,570 people over the last decade. Average annual population growth (DEMAND) over the last four years was 360,000 - slightly LESS than the 10-year average.
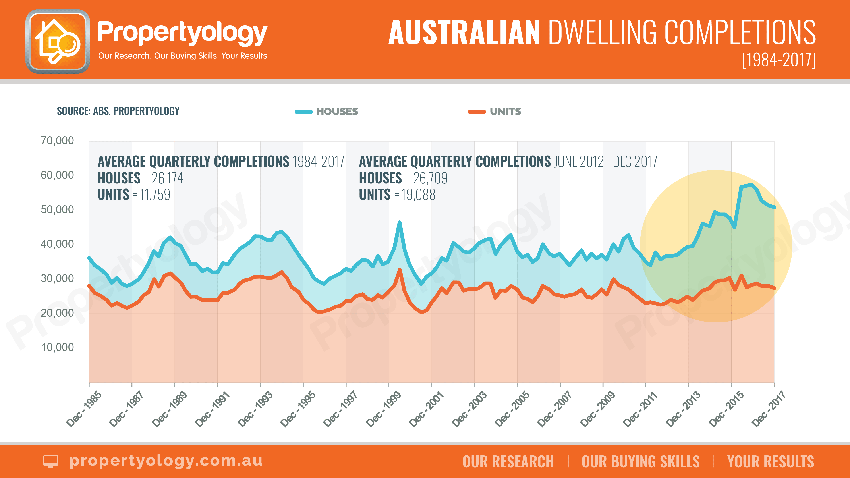
Meanwhile, supply at a macro-level saw an average of 170,577 additional dwellings completed over the last decade. The average annual dwelling SUPPLY over the last four years was 200,034 – significantly MORE than the 10-year average.
The situation at a state-by-state level varies widely across the country. That’s where this FREE eBook comes in handy.
This eBook focuses on base-level analysis of DEMAND (population growth) and SUPPLY (additional dwellings completed) for the 33-year period ending December 2017, in Australia’s eight states and territories.
Your FREE download contains detailed analysis of population growth, volumes of detached houses versus apartments from quarter to quarter, infographics, plus some interesting ‘Fun Facts’.
Information is power! To get your copy, simply click on the above graphic.
Propertyology is a national property market researcher and buyer’s agency who buys properties exclusively for investors in strategically-chosen locations all over Australia. The multi-award-winning firm’s success includes being winner of 2018 REIQ Buyer’s Agency of the Year and a finalist in the 2017 Telstra Business Awards. For information about how we can help you invest, contact us here.


