Australia’s Population Analysis
Promoted by Propertyology.
1,063 people per day: that’s how much Australia’s population grew by during the 2017 financial year. Propertyology has analysed population trends of every location in Australia, including the movement in some exciting locations outside of the 8 capital cities.

It’s estimated that the population clock will tick over to 25 million in early July 2018.
Last year’s population increase of 388,124 was the fifth largest on record but quite a bit short of the 442,454 increase in 2008/09.
Overseas migration accounted for 245,408 (63.2 per cent) of population growth while the remaining 142,716 was natural growth (births minus deaths).
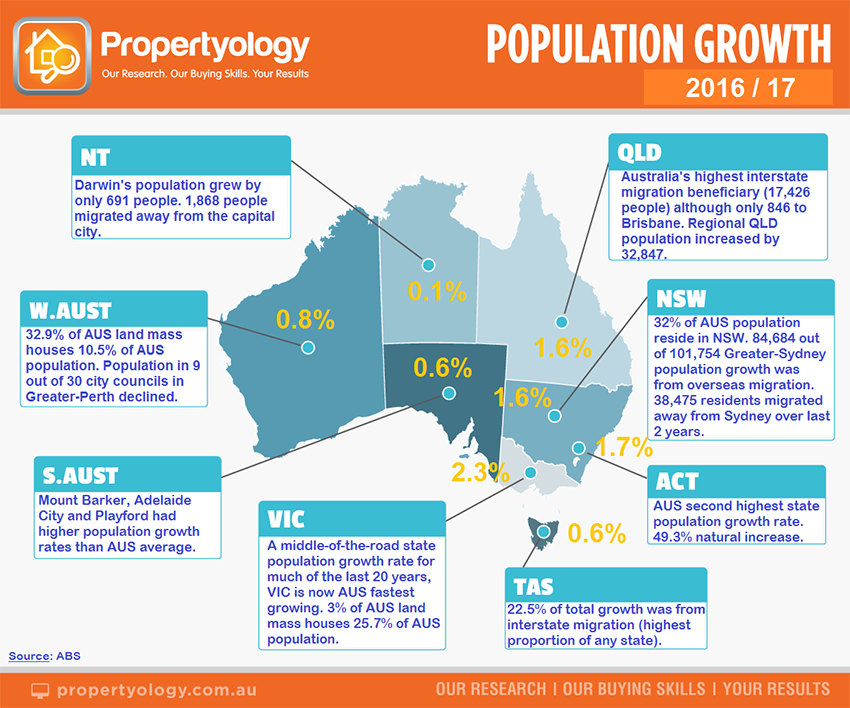
Melbourne’s population is currently growing the fastest. And, we probably already knew that Sydney and Melbourne combined represents 40 per cent of Australia’s total population. But you may not have realised that 38,745 residents relocated away from Sydney over the last 2 years.
Darwin (0.5 per cent), Adelaide (0.7 per cent), Perth (1 per cent) and Hobart (1.1 per cent) were below the national average of 1.6 per cent.
It’s not all about capital cities. The population of regional Australia increase by 77,740 people last year – in ONE year!
34 per cent of Australia’s population choose to not live in our 8 capital cities (that’s 1 in 3 people). Across the country, there’s a plethora of regional locations with a stable population base, essential infrastructure, and affordable housing; many play the role of a ‘mini capital city’.
Population in the city councils of 33 regional locations increased at a rate equal to or better than four capital cities, including the hottest property market in Australia for the last two years, Hobart.
QUEENSLAND
- State:Queensland’s population as at 30 June 2017 was 4,928,457. The 1.6 per cent growth rate was comparable to New South Wales and the Australian average. Net overseas migration (31,148 people) and natural growth (31,006) had similar contributions.
- Brisbane: Greater-Brisbane is made up of five city councils (Logan, Ipswich, Moreton Bay, Redland, and Brisbane - Australia’s largest city council). Population increased by 2 per cent (up from 1.8 per cent the previous year). Ipswich (3.2 per cent) and Moreton Bay (2.2 per cent) grew the fastest. While Queensland was Australia’s biggest beneficiary of interstate migration in 2016/17, only 846 of the 17,246 net-inflow relocated to metropolitan Brisbane.
- Regions: More people reside in regional Queensland than Brisbane, making it the most decentralised mainland state. 8 of Australia’s 30 biggest cities are located across regional Queensland. Population growth was strong in Cairns (1.3 per cent), Fraser Coast (1 per cent), Gold Coast (2.7 per cent), Lockyer Valley (1.8 per cent), Scenic Rim (1.9 per cent), and Sunshine Coast (2.7 per cent).
VICTORIA
- State:The land within the Victorian border represents 3 per cent of Australia’s land mass and is home to 25.7 per cent of Australia’s total resident population. Comparing its annual growth rate to other states, Victoria was a middle-of-the-road performer for much of the last two decades however, it has been the strongest performer since 2014.
- Melbourne: In 2016/17, Melbourne’s CBD municipality population grew more than five times higher than the national growth rate (11,953 people, or 8.1 per cent). Wyndham (6.1 per cent), Cardinia (5.0), Melton (5.0), Whittlesea (4.1), Casey (4.4), and Hume (3.9) were also very high. Interestingly, large volumes of existing residents migrated away from Monash (3,424 people), Brimbank (2,312) and Greater-Dandenong (2,311)
- Regions: 75.5 per cent of Victoria’s population reside in the state’s capital, making it Australia’s least decentralised state. That said, 20,995 extra people took up residency in regional Victoria in 2016/17. Surf Coast (2.9 per cent), Baw Baw (2.8), Bass Coast (2.7), Geelong (2.6), Golden Plains (2.5), Ballarat (1.9), Macedon ranges (1.9), Wodonga (1.8), and Bendigo (1.6) all had population growth rates equal to or above the national average.
SOUTH AUSTRALIA
- State: South Australia’s population increased by 10,494 people (0.6 per cent). What the state gained from natural growth (births minus deaths) it equally lost to interstate migration (5,941 people).
- Adelaide: Population in the ‘City of Churches’ increased by 0.7 per cent to 1,287,388. The biggest increase was in Adelaide’s city (2.2 per cent), Playford (1.7 per cent) and Gawler (1.5 per cent). Port Adelaide Enfield attracted the highest volume of overseas immigrants in the year (1,207 people).
- Regions: The state’s highest population growth rate was in Mount Barker (2.5 per cent) while Port Lincoln (0.5 per cent) and the neighbouring Lower Eyre Peninsula (1 per cent) also produced good growth.
TASMANIA
- State:Economic growth, affordable housing, and lifestyle have proven to be a recipe for success for Tasmania. The 1.1 per cent population growth rate was the state’s highest since 2010. 22.5 per cent of the growth came from interstate migration, the highest proportion of all Australian states and territories.
- Hobart: Proving that property price growth is much more than population growth, the state capital produced the fifth highest Australian capital city population growth rate (1.1 per cent) however, the capital growth produced by its property market is streaks ahead of all other Australian location. The highest volume of population growth occurred in Clarence, Kingborough, Hobart city, and Glenorchy city council areas.
- Regions: The highest annual population growth rate was in the state’s north (West Tamar, 1.6 per cent) and far south (Huon Valley, 1.5 per cent).
NEW SOUTH WALES
- State: One out of three Australians (32 per cent) reside in New South Wales. The state’s population growth rate of 1.6 per cent last year was equal third with Queensland.
- Sydney: Of Greater-Sydney’s 101,754 population increase, 84,684 immigrated from overseas. In excess of 5,000 overseas migrants became residents in the city council areas of Sydney city, Parramatta, Canterbury-Bankstown, and Cumberland. On the other hand, 17,943 people migrated away from Sydney last year to another Australian location, including 2,984 people leaving Randwick.
- Regions: The population increased in regional New South Wales by 20,049 people in 2016/17; that’s similar population growth to Perth’s last year and more than Adelaide, Canberra, Darwin or Hobart.

WESTERN AUSTRALIA
- State: 5 per cent of Australia’s population (2,580,354 people)reside in Western Australia,which has a land mass covering 32.9 per cent of the country.The 0.8 per cent population growth in 2016/17 was the third consecutive year below 1 per cent. It now feels like a long time ago that WA consistently had Australia’s highest population growth, increasing by 21.3 per cent in just 7 years ending 2013.
- Perth: 71.3 per cent of the state’s population reside in Perth. 9 out of 30 city councils that make up Greater-Perth saw population decline in 2016/17 (Bayswater, Cambridge, Joondalup, Melville, Mosman Park, Peppermint Grove, South Perth, Victoria Park). On the flip said, Kwinana (4.6 per cent) and Armadale (3.3 per cent) were among Australia’s highest population growth rates.
- Regions: Augusta-Margaret River in the state’s south ~ a popular tourism and winery location ~ saw population increase by 2.9 per cent (nearly double the national average).
AUSTRALIAN CAPITAL TERRITORY
- The Nation’s official capital now has a population of 410,301 people, making Canberra Australia’s eighth largest city. ACT’s population growth rate of 1.7 per cent was Australia’s second highest. 49.3 per cent of the annual increase was natural growth (births minus deaths) while 41 per cent was net overseas migration.
NORTHERN TERRITORY
- State: The Northern Territory has a population of 246,105, representing 1 per cent the nation’s total population. Between 2007 and 2013, population in the NT grew by an impressive 2 to 3 per cent per year. 2016/17 growth of 0.1 per cent was miserable.
- Darwin: 59.4 per cent of NT’s total population reside in Australia’s ‘Top End’, Darwin, where population increased by a paltry 691 people over the year.
An important word of caution to anyone using population data to help determine where you might invest. Population growth is rear-view-mirror stuff. The latest ABS data covers the 2016/17 financial year which commenced July 2016 (almost 2 years ago).
To help appreciate that there’s other forces at play within property markets, keep in mind that Australia’s 2 cities with the highest population growth right now have recently seen property prices fall. While population growth is a factor, there are numerous other factors.
Job creation is major influence of where population is pulled towards. This changes from year-to-year depending upon which industry sectors are performing well, policies by all levels of government, and major infrastructure projects.
Propertyology is a multi-award-winning buyers agency and national property market research firm. We help everyday people to invest in strategically-chosen locations all over Australia. As the only company in Australia to correctly forecast Hobart’s resurgence before the boom, the firm’s success includes being a finalist in the 2017 Telstra Business Awards and 2018 winner of Buyers Agency of the Year in REIQ Awards For Excellence. Here’s how to contact Propertyology.

