National housing values soar 39% over last half decade
While national housing values have surged from “strong upward pressure” over the past five years, recent industry research showed that values remained “well below” the historic peaks of previous decades.
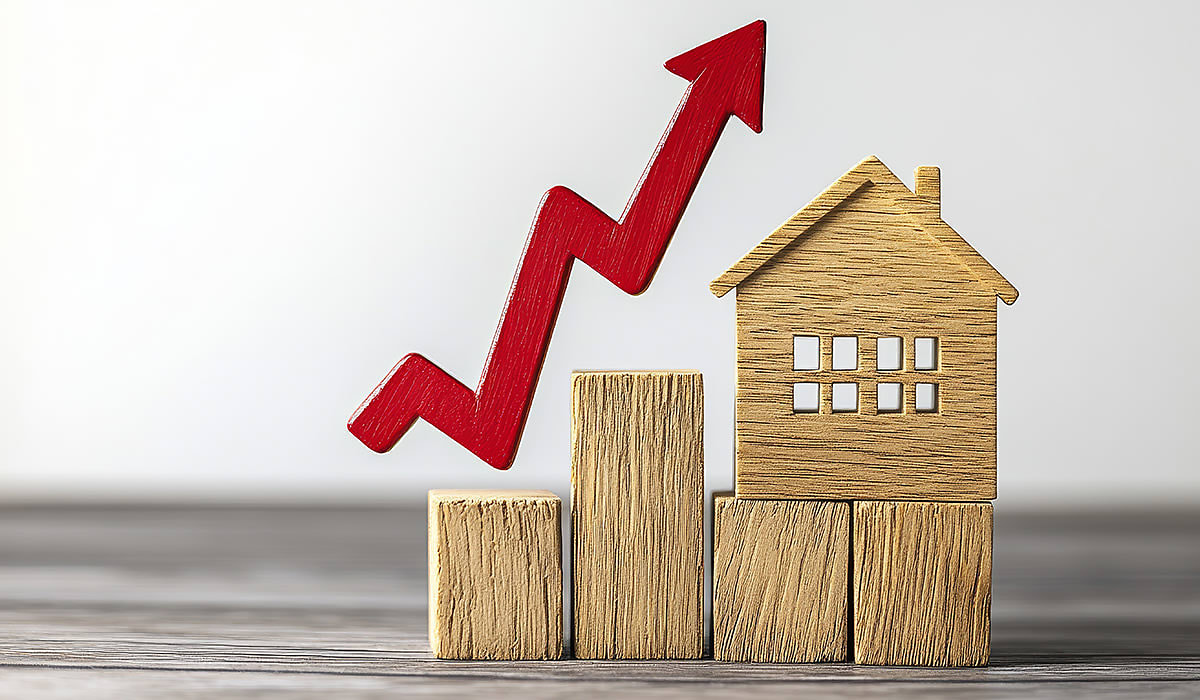
CoreLogic’s Monthly Housing Chart Pack for April has revealed that national housing values surged 39.1 per cent over the past five years in Australia’s market, adding approximately $230,000 to the median dwelling value.
Over the latest rolling quarter, national home values rose 0.7 per cent, with the capital cities up 0.5 per cent and the regional markets up 1.4 per cent.
During March of 2025, CoreLogic’s data showed that there were 42,553 sales across the nation, which took the rolling 12-month count to 528,212.
Despite the number of property sales being 2.1 per cent below the recent peak record in December (539,743), the annual number grew by 4.6 per cent compared to last year and 4.1 per cent above the previous five-year average.
CoreLogic economist Kaytlin Ezzy said the 39.1 per cent growth in values over the past five years reflected strong underlying housing demand, tight supply, and a “relatively resilient economy”.
“Outside of a few short months of declines, values have seen strong upward pressure over the past five years, driven by low stock levels and increased demand,” Ezzy said.
Nevertheless, Ezzy noted that this growth cycle remains “moderate” compared to earlier periods, during which financial deregulation, strong economic growth and favourable demographic shifts helped fuel “remarkable value growth”.
CoreLogic’s report showed that the latest five-year national home growth of 39.1 per cent still remains well below the 75.5 per cent growth achieved over the five years to March 1989, and the record 79.7 per cent growth in the five years to December 2003.
Ezzy said that population growth, the deregulation of financial markets, and declining interest rates following the 1982–83 recession helped to boost housing demand during the late 1980s, and put upward pressure on values.
“Additionally, the introduction of capital gains taxes in 1985, with an exemption for primary residences, drove an increase in owner-occupier demand,” she added.
Similar to the 1980s, Ezzy attributed the record growth over the five years to December 2003 to the effects of the low-interest rate environment, alongside the strong economic growth after the Asian financial crisis and the beginning of the 2000’s mining boom in Australia.
“Changes to capital gains taxes benefitting investors, and the introduction of first home buyer grants, also helped stimulate housing demand in the 2000s,” Ezzy said.
Even though the increase in housing values over the past five years is relatively mild in percentage terms, Ezzy emphasised that the recent rise “far outperforms the historic peaks” in dollar terms.
While the most recent five-year increase remains around half that of the previous peaks, Ezzy noted that the rise, when adjusted to the current median value, is equivalent to a “roughly $230,000 increase”.
“By comparison, the dollar rise seen over the five years to December 2003 was roughly $90,000 less, at $140,000, while the March 1989 increase was equivalent to around a $60,000 increase in the median,” Ezzy explained.
Timing of peak growth varies across the capital cities
CoreLogic’s research showed that the historic trend in five-year growth follows a similar shape across the capitals, but varies in terms of which five-year period each capital city achieved its peak growth.
The strongest rolling five-year growth period for Sydney values occurred in the late 1980s, reaching 80.7 per cent, which narrowly surpassed the 78.3 per cent rise recorded over the five years leading up to November 2003.
Similar lifts were observed in Melbourne, with the almost doubling of values in the ’80s (98.8 per cent) outperforming the 79.5 per cent rise from the early 2000s.
However, cities such as Brisbane, Adelaide, Perth, Hobart and Canberra recorded their largest five-year gains over the mid-2000s, with values across these markets roughly doubling.
Perth’s peak growth of 137.8 per cent over the five years leading up to September 2006 was the largest among the capitals, nearly double the 75.2 per cent increase observed in the city during the most recent five-year period.
“Strong economic conditions and positive interstate migration amid the 2000’s mining boom, saw housing values in the western capital skyrocket before falling through much of the 2010s,” Ezzy said.
Ezzy noted that Brisbane benefitted from strong interstate migration and a surge in demand in the early 2000s.
Similarly, she said that the “relatively affordable price points and broader positive environment” bolstered housing values in Hobart and Adelaide during their peak growth periods.